I’m a back-end software engineering intern at Perpetua, so when I was asked if I wanted to take on integrating Lighthouse tests into our front-end CI workflow, I felt way out of my league. Although I’ve also done quite a bit of front-end work at this point, it’s been nothing like CI integration, which I felt would have broad implications of impacting the whole engineering team, not just one squad’s feature. Fortunately, my supervisors believed in me enough to put me on the task anyway (with a great mentor!) and we were off to the races 🏇
What is Lighthouse?
Lighthouse runs against a webpage and evaluates it for metrics such as performance and accessibility, providing recommendations for improvement as part of its report — all very important for helping us make the best product we can. We wanted these tests to run seamlessly as part of our current workflow on GitHub, and since we’ve already started to use Cypress, we’d like to combine those two. Enter, Cypress-Audit.
The Easy Part
The beauty of software development is you’re never working alone. (Yay, open-source!) The instructions to add Lighthouse to Cypress were straightforward. We ignored anything pertaining to pally() (another test runner that specifically runs accessibility tests in addition to those already run by Lighthouse) and made sure to call cy.lighthouse(); at least after cy.visit(...); in a Cypress test so that it has a url for the page to audit. Then we set some thresholds.
Lighthouse has default thresholds that it measures, but we can create our own and pass them into cy.lighthouse(); in the Cypress test file. It would look something like this:
const thresholds = {
 performance: 80,
 accessibility: 80,
 seo: 80
}
cy.lighthouse(thresholds);
The First Challenge
We wanted to run Lighthouse against the desktop version of our site, but its default is to run on mobile. If you try logging into app.perpetua.io for yourself on mobile, you’ll see a screen like the one emulated by cypress-audit here:
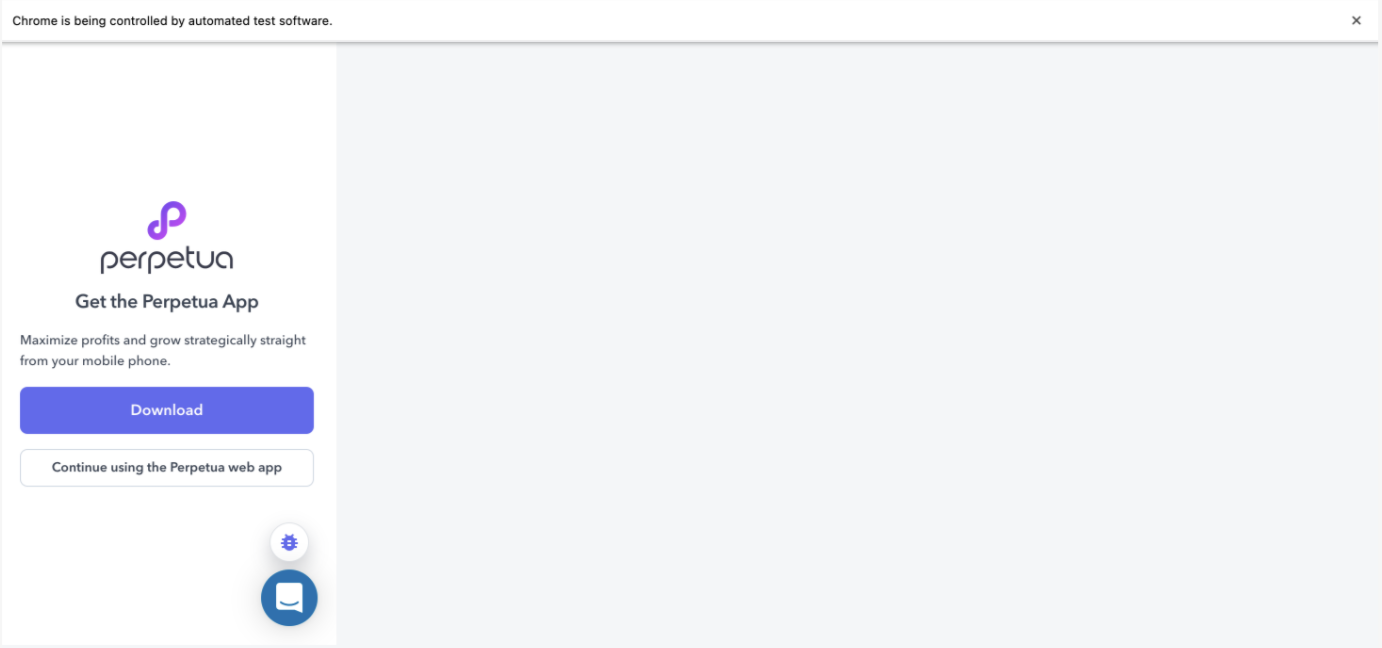
The reason we have this screen is to encourage mobile users to download our app for a better user experience, but this is not the screen we want to audit. Unfortunately, all the usual tricks to get Lighthouse to use desktop-mode weren’t working as expected. Setting the formFactor to 'desktop' didn’t work. Setting mobile screen emulation to false didn’t work. (They just made the screen bigger, but stayed on this download prompt page istead of taking us to the web app.) If you’re in a similar position, you’re in luck, we rooted around Google for you to find that in the Cypress test file, before calling cy.lighthouse();, we want to add something like:
const options = {
 formFactor: 'desktop',
 screenEmulation: {
  width: 1350,
  height: 940,
  deviceScaleRatio: 1,
  mobile: false,
  disable: false,
 },
 emulatedUserAgent: false,
};
And then pass it in: cy.lighthouse(thresholds, options);
This works because the logic that checks if the user is on mobile uses something called user agent, a string that ID’s the browser and OS.
Note that the lighthouse function in cypress-audit is expecting thresholds to be passed in first before options.
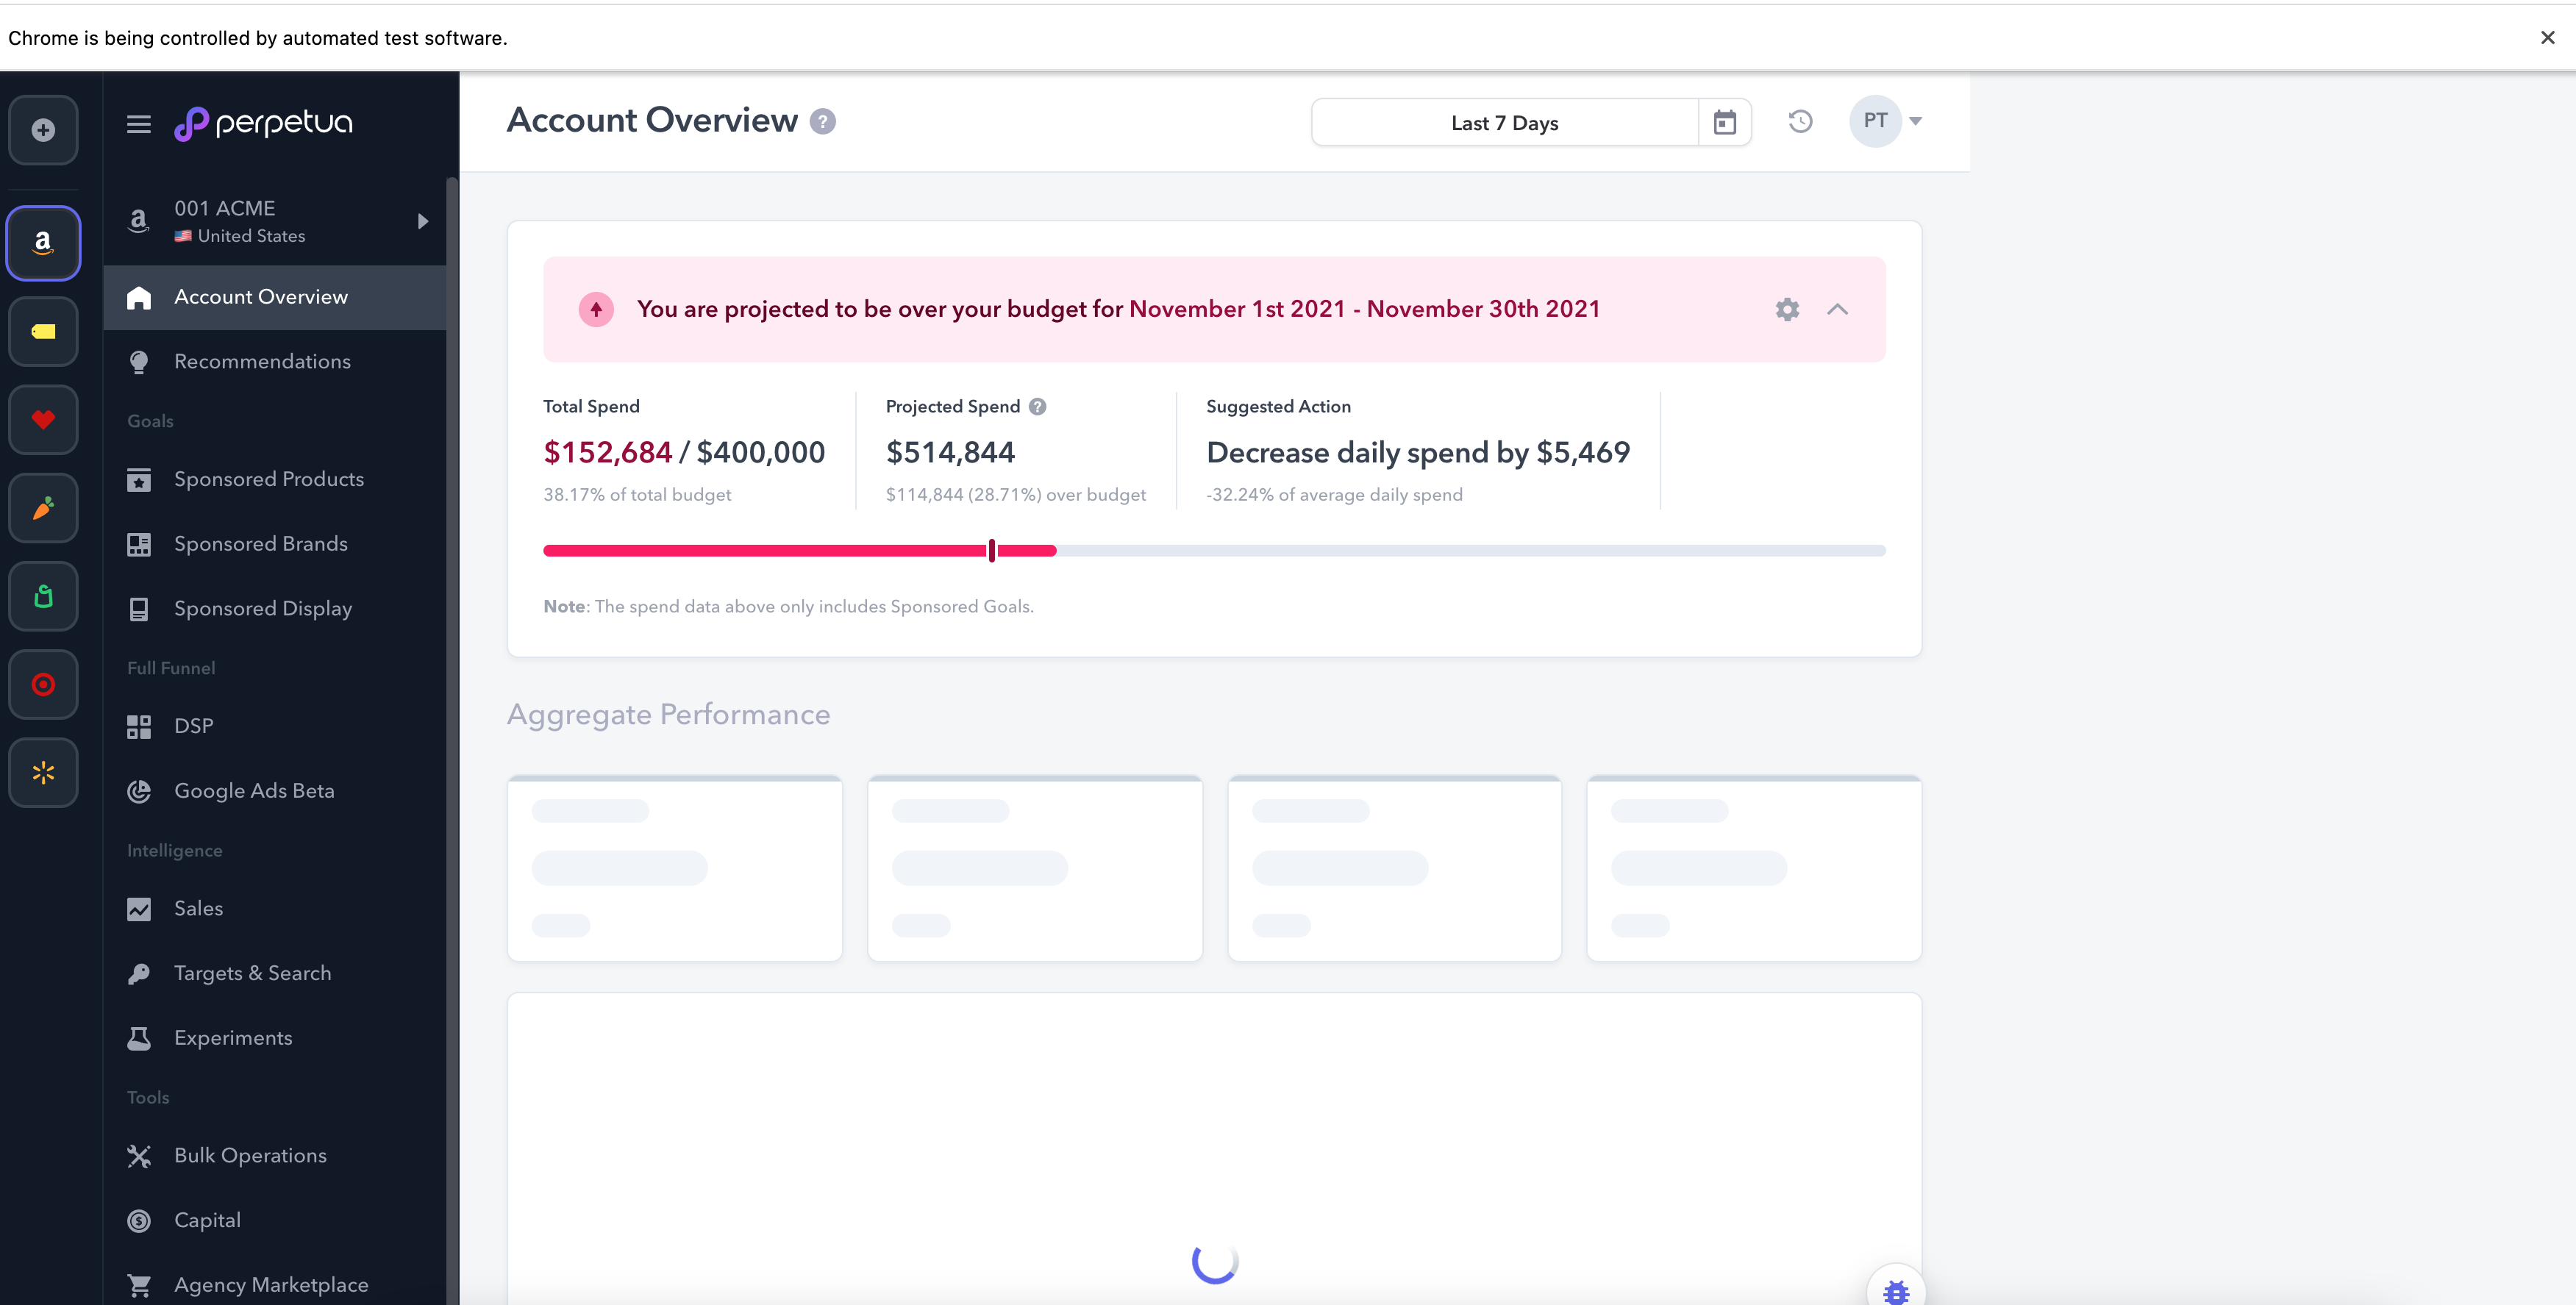
Now we can audit our full Account Overview page 🎉
Side Quest
If you’re following along with this tutorial, you’ve accomplished a lot by this point! Take a breather with this small side quest 😉
Lighthouse runs against the target webpage 3 times and takes an average for each metric across those three runs. So for tests that may take longer, in the Cypress test, we can use taskTimeout:
describe('Lighthouse x Cypress', {taskTimeout: 90000ms}, () => {...});
Final Push
Lastly, we want to access the Lighthouse reports as HTML files. Once again, the tutorials I could find on Google weren’t working for us, so it was time to mix and match and dig into the cypress-audit node module.
The original line in cypress/plugins/index.ts is lighthouse: lighthouse(), where the first lighthouse: is the name of the Cypress task. This is why calling cy.lighthouse() in our cypress tests works. The second lighthouse() is the actual function call that runs Lighthouse and if we pass a callback into it, we can get our HTML report. So we rewrote lighthouse: lighthouse(), as:
lighthouse({ url, thresholds, opts, config }) {
 const callback = (lighthouseReport) => {
  writeFileSync("lhreport.html", generateReport(lighthouseReport.lhr, 'html'));
 };
 const lighthouseRunner = lighthouse(callback);
 return lighthouseRunner({ url, thresholds, opts, config });
},
Note that at the top of the file, we have two additional imports to support this:
import { writeFileSync } from 'fs';
import { generateReport } from "lighthouse/report/generator/report-generator";
To create names for the reports that help associate them with the tests that generated them, you can also add something like cypress: { testName: "myTest" } to the options constant. Then that name can be accessed from inside the index.ts lighthouse function using opts.cypress.testName. This helps if you want to automate many tests and keep your reports organized!
Merge with your desired branches, and you’re done! If you have a GitHub workflow like ours, we run our CI tests headless (e.g. cypress run) and lighthouse reports can’t generate on headless runs, so the workflow is: if you create a change that doesn’t pass a lighthouse threshold, thus failing the headless test, investigate by running a test locally on a browser (e.g. cypress open), which will generate a full report. More on running Cypress tests [here][cyrpess-docs].
I hope this was helpful 😊
What’s next for Perpetua?
We always want users to have a positive experience with our product, but it’s not always easy to see where problems will arise for users across different levels of experience, backgrounds, etc. That’s why leveraging Lighthouse’s user-centred metrics is very attractive to us for building a better user experience. Now that we’re all set up, we have our eyes on improving our metrics and gathering even more! 🚀
🌱 Come grow with us!
- Engineering Manager (m/f/d) - Remote possible
- Senior Data Engineer (m/f/d) - Remote possible
- Principal Front End Engineer
- Senior Data Scientist (m/f/d) - (EU) Remote friendly
- Senior Software Development Engineer In Test (Javascript)
- Senior Software Engineer - Frontend
- Software Engineer - Backend
- Senior Software Engineer - Backend